Germans went to the polls to elect a new parliament and along with it a new government and a new chancellor. Since outgoing chancellor Angela Merkel did not stand for re-election after 16 years in office, this election marked a turning point in German politics. Without her standing as ‘Spitzenkandidat’, the election campaign turned into a heated fight for voter support with three parties having led the polls at times in the run-up to the election (CDU/CSU, SPD and the Greens). The final result saw the Social Democrats (SPD) winning the race after having trailed in the polls for a long time. They started catching up a few weeks ahead of the election and ended up securing 25.7 percent of the votes in the list vote (Zweitstimme) that determines the proportional distribution of seats (5.2% more than in 2017, resulting in 206 seats of the 735 seat strong parliament).
Having lost 7.9 percent points, CDU came second with 18.9 percent of the list vote (151 seats). The Green party (Grüne) came third with their best-ever result in a federal election, winning 14.8 percent of the list vote (up 5.8%, 118 seats), yet far lower than the mid-20s they polled in earlier in the year. FDP remained at a stable 11.5 percent (up 0.7%, 92 seats). The extreme right ‘Alternative for Germany‘ (Alternative für Deutschland, AfD) re-entered federal parliament (Bundestag) but with a smaller vote share of 10.3% (down 2.3%, 83 seats). CSU, the Bavarian sister-party of CDU won 5.2 percent (down 1%, 45 seats) Die Linke went down to 4.9% of the list votes but remains in parliament through the number of directly elected seats from the constituency vote (39 seats). Danish minority party SSW reached 0.1 percent in the list vote but gained one seat through special rules for parties representing minorities. Other parties not represented in parliament accounted for 7.2 percent of the valid votes.
Coalition talks are ongoing so that it is not clear yet, which parties are going to form the next government and who will become the 9th Federal Chancellor since 1949. This gives time to ponder over all the political changes that happened across the country – what better way to do so than through a series of maps, such as the 18 maps shown in this blog that dissect over 22,000 data points in cartographic form. Let’s start with an overview: The following pair of maps shows on the left the winning parties of the constituency vote (Erststimme) which directly elects a constituency into parliament and on the right the strongest party in the list vote (Zweitstimme) which determines the proportional representation for each party in the new parliament. These results are shown in large as gridded population cartograms which are proportional to the respective population there, accompanied by a small ‘conventional’ land area map:

Equal population projection map of the First and list vote Results in the 2021 German General Election / Bevölkerungsrastertransformationskarte der Ergebnisse der Bundestagswahl 2021
How significant these results are can be seen when viewing the list vote winners of the previous 2017 and this year’s 2021 general election side by side:
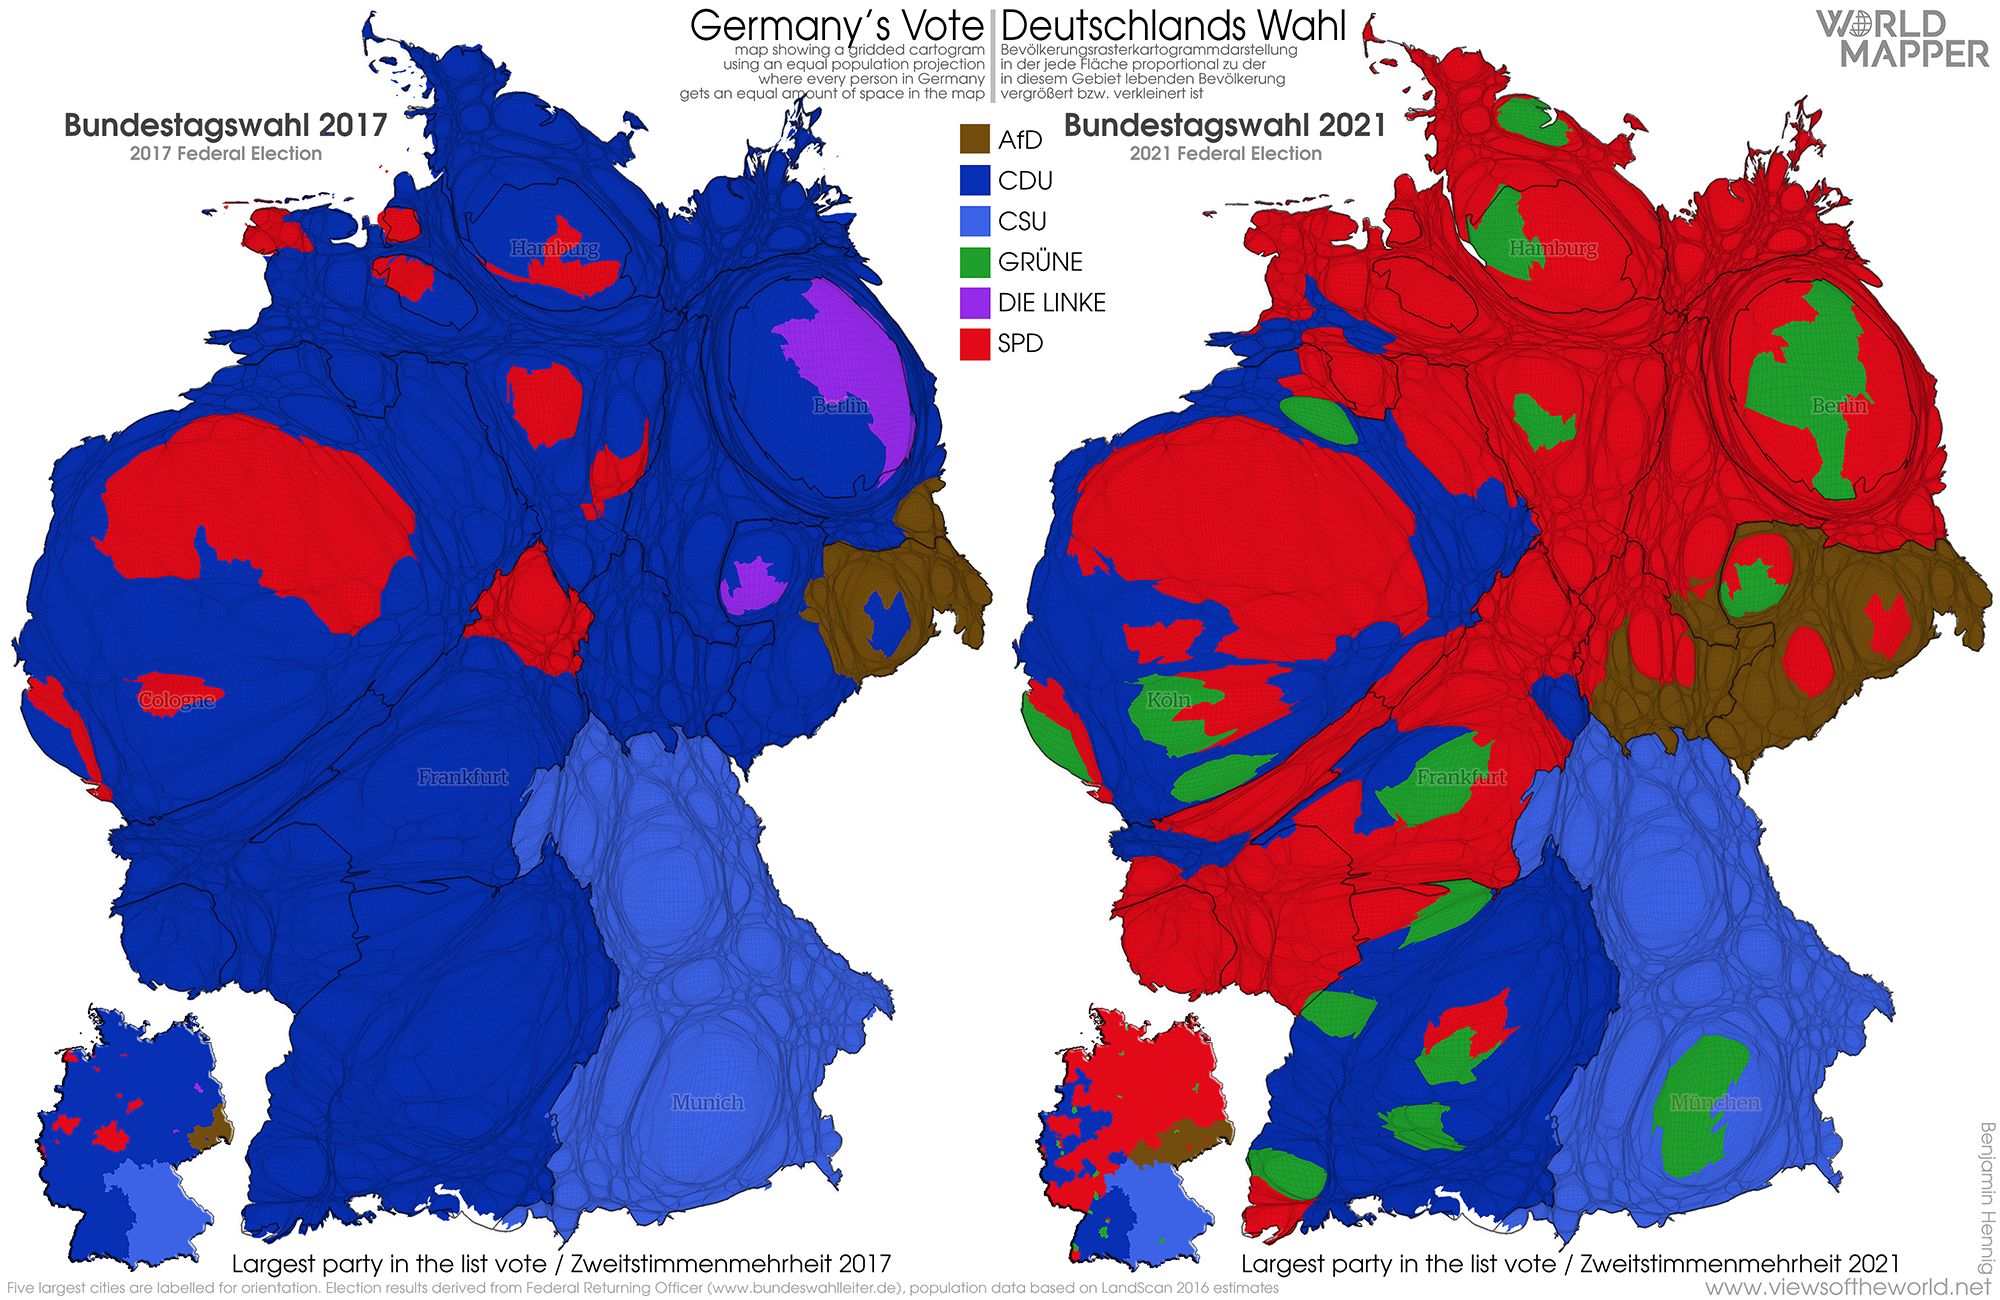
Equal population projection map of the Constituency Vote Results in the 2017 and 2021 German General Election / Bevölkerungsrastertransformationskarte der Erststimmenergebnisse der Bundestagswahlen 2017 und 2021
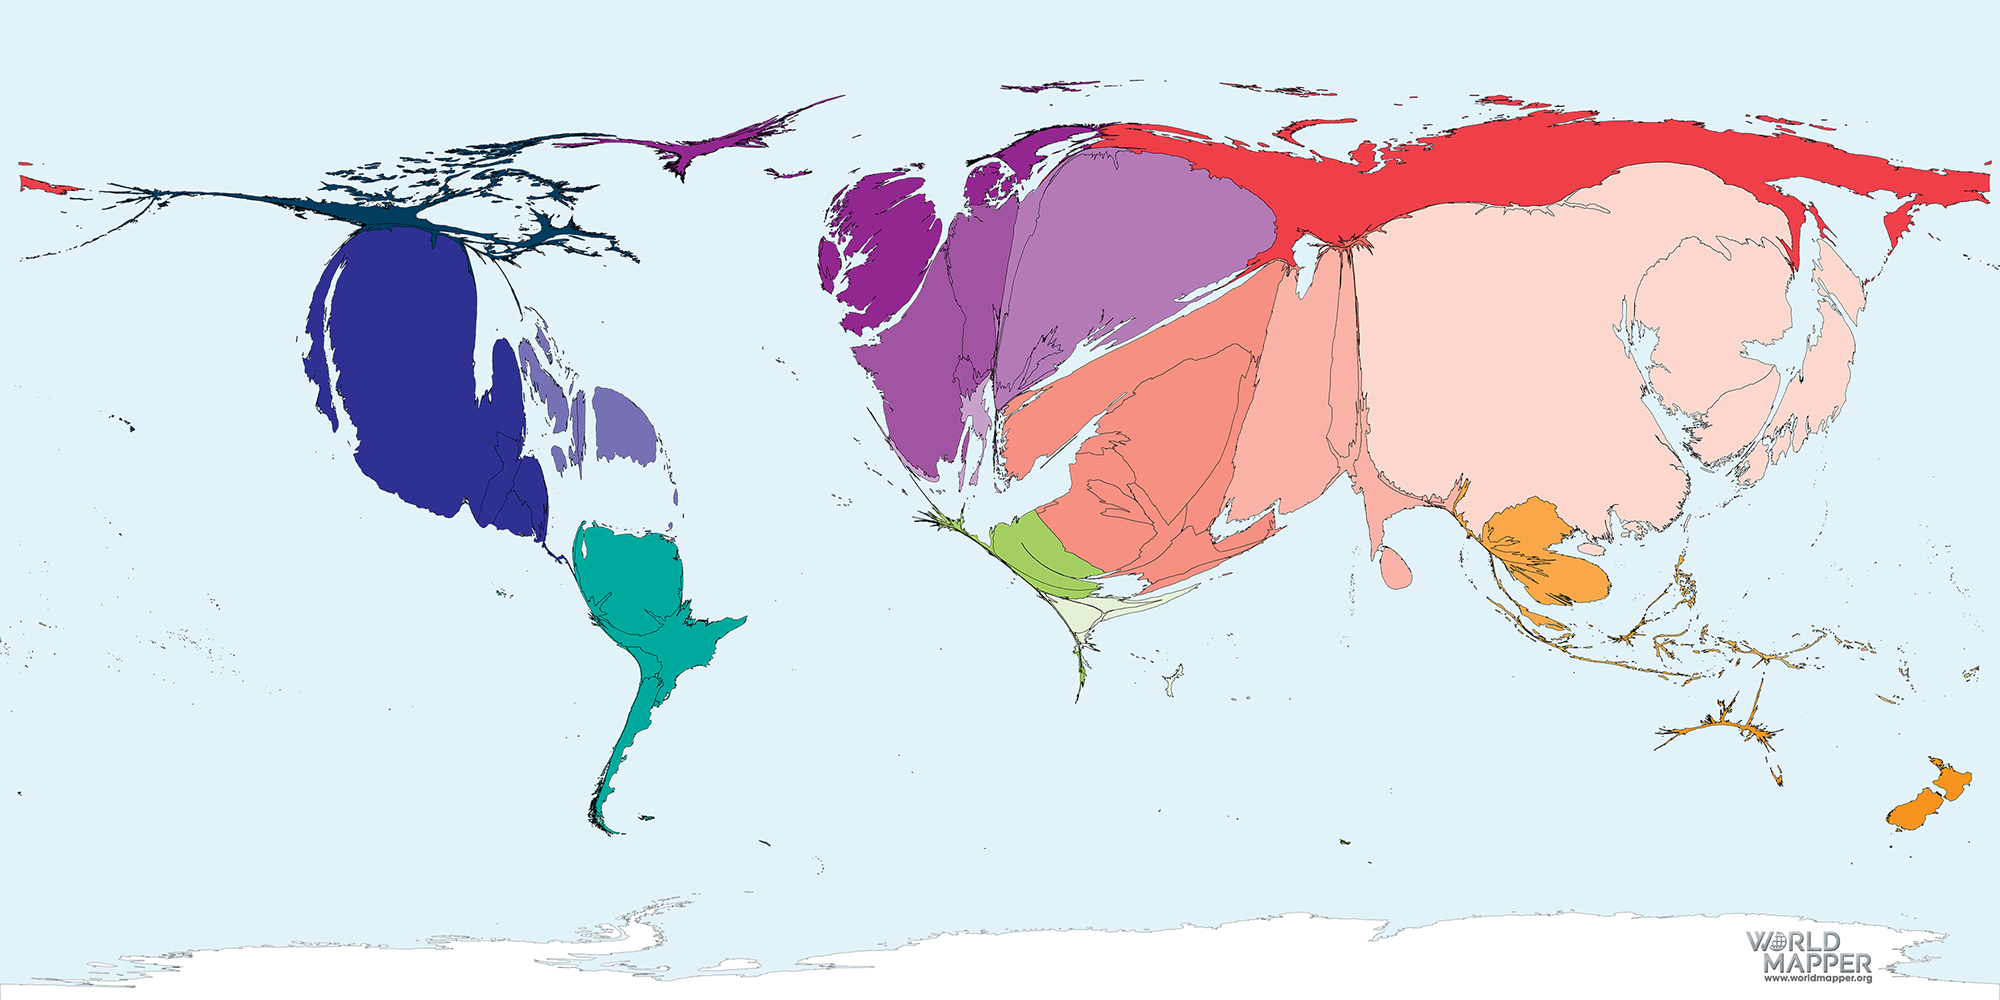
In these cartograms, each transformed grid cell reflects the total number of people living in that area. The following topographic cartogram provides a reference for the electoral maps above:

Since Germany’s electoral system is based on proportional representation, the above shown election maps reveal only part of the changes that were unfolding in this year’s general election since they focus on the strongest party only. The following cartogram series provides a detailed look into the changed political landscapes of Germany following the 2021 Federal election in September. The cartograms give a clearer picture of the vote share distribution for each major party, as well as an overview of turnout and spoilt votes. The vote shares determine the constitution of parliament, in combination with the gained seats from the constituency vote that are counted against the vote share of the list vote for each party.
Despite an increased turnout, which went up to 76.6 percent (from 76.2 percent in 2017), non-voters are the single-largest group in German politics. With 14.3 million eligible voters who decided not to vote, this group is even larger than the total number of votes of the largest party (SPD), which received 12.2 million total votes in the list vote (Zweitstimme). The following two maps show the distribution of turnout and also the distribution of the 499,163 spoiled votes on an equal-population projection:
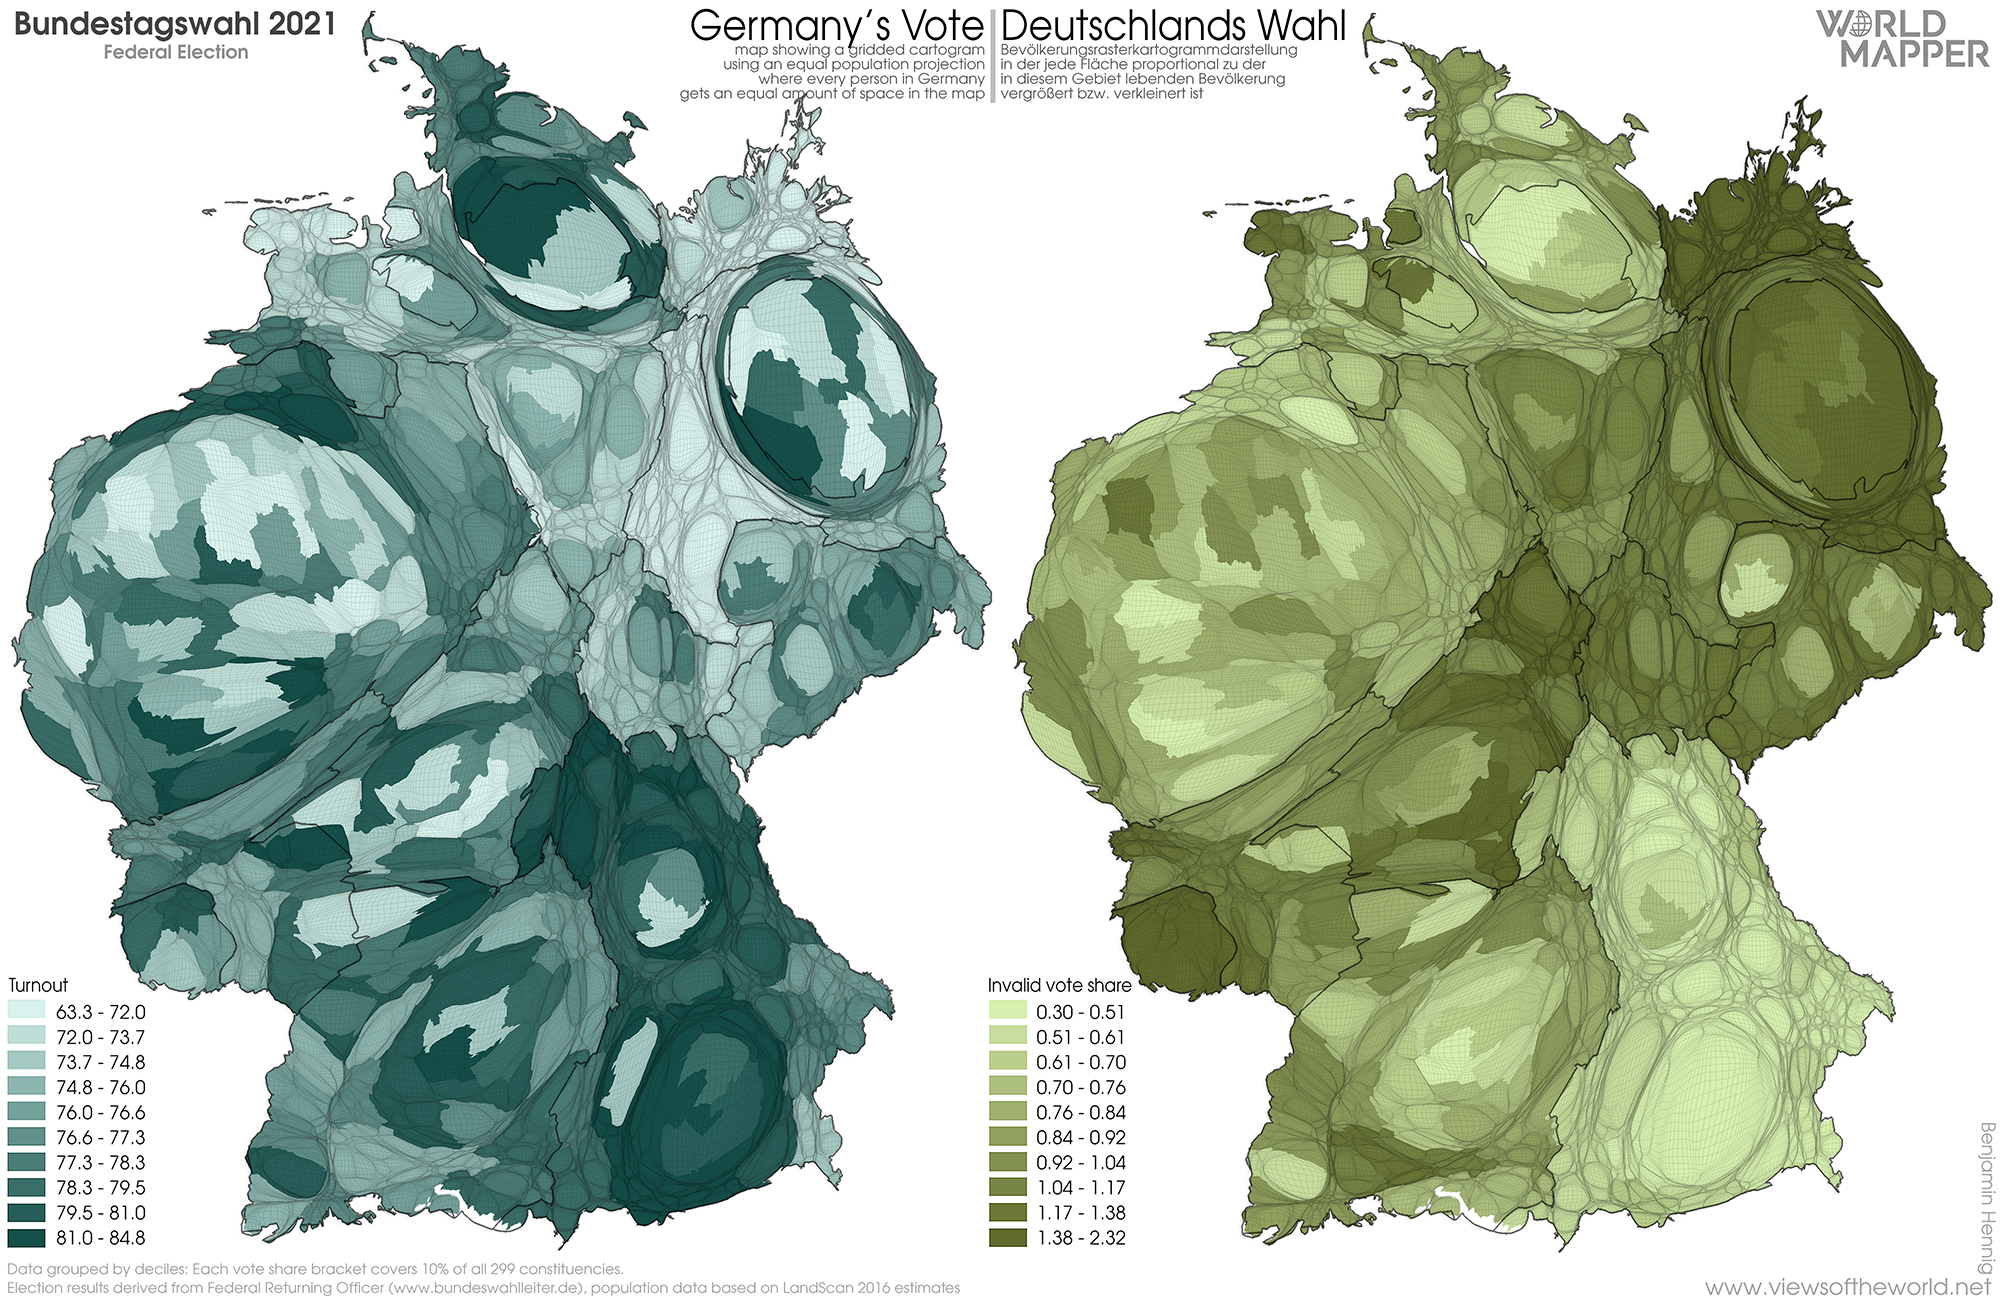
Equal population projection map of turnout and invalid votes in the 2021 German General Election / Bevölkerungsrastertransformationskarte der Wahlbeteiligung und der ungültigen Stimmen bei der Bundestagswahl 2021
The above two maps as well as the vote share in the following maps shows the underlying data divided into decile groups based on the country’s 299 constituencies. This means that 10 percent of the constituencies fall into each of the 10 classes depicted in the maps. This allows for a better understanding of each party’s strongholds across the country and therefore gives a picture of the new political landscapes that are going to shape German politics in the forthcoming years.
The following maps visualise the vote share of all parties that are represented in the new parliament. A party needs to reach 5 percent of the vote share to enter parliament unless it manages to secure a direct seat through the constituency vote. Not shown here is the map for Südschleswigsche Wählerverband (SSW), a Danish minority party in Northern Germany for which the 5 per cent rule does not apply and which secured one seat in the new parliament. In order to also understand how these political landscapes have shifted and changed since the last election, the map on the right shows, how each party’s vote share has changed in percent point compared to the 2017 general election). The classes in the change maps remain constant in all maps which allows these changes to be seen in comparison across all parties. The maps below are ordered in decreasing order of each party’s vote share at the 2021 election:
SPD (25.7% / 206 seats)

Equal population projection map of the SPD vote share in the 2021 German General Election / Bevölkerungsrastertransformationskarte der SPD Zweitstimmenergebnisse der Bundestagswahl 2021
CDU/CSU (18.9/5.2%, 151/45 seats)
Shown in a combined map since the two sister parties do not compete:
CSU stands for election in Bavaria only, where CDU does not operate
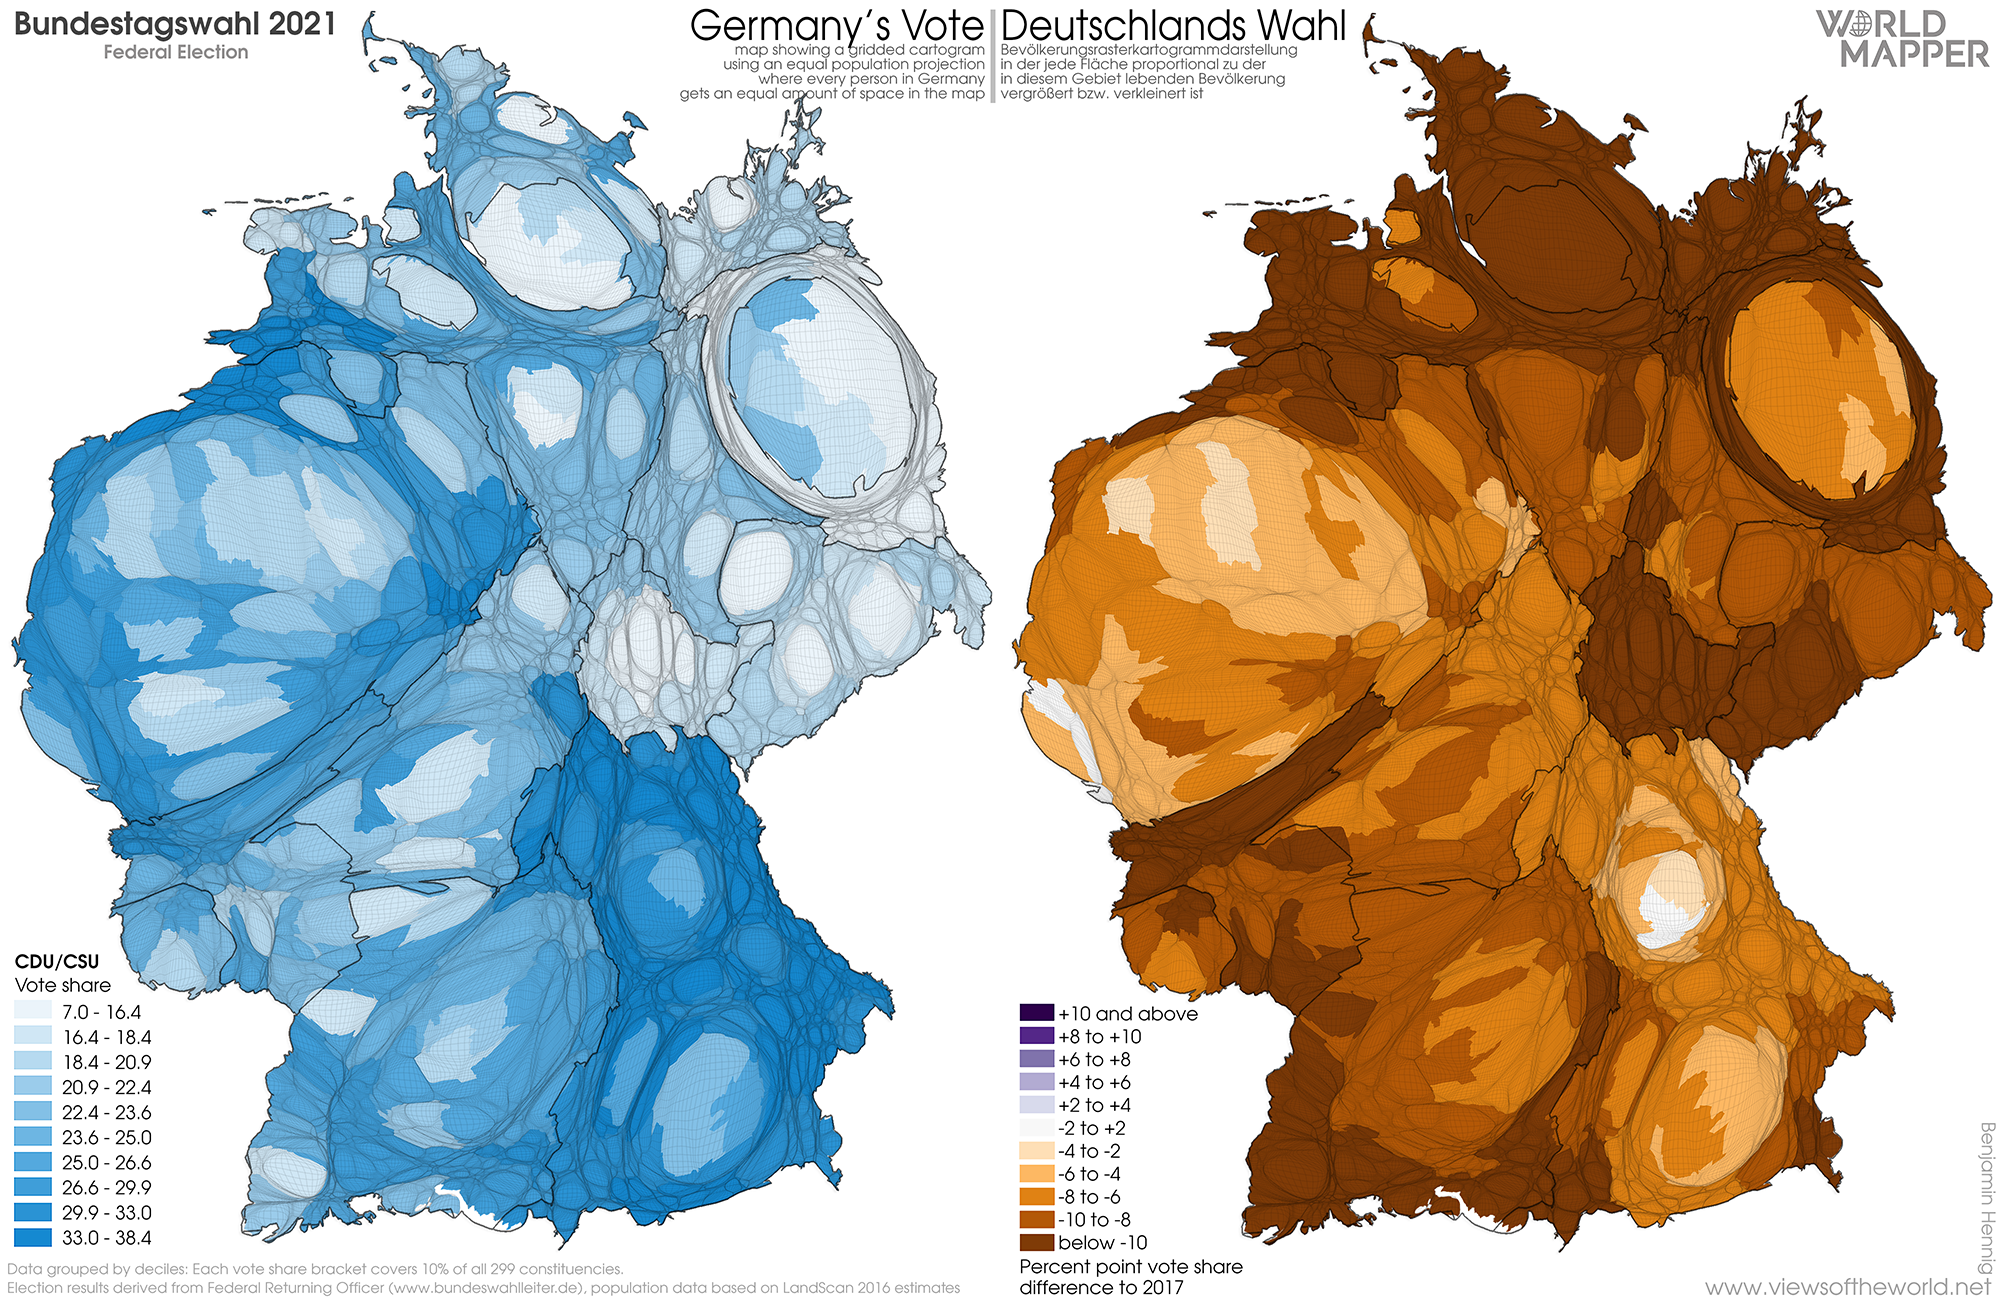
Equal population projection map of the CDU/CSU vote share in the 2021 German General Election / Bevölkerungsrastertransformationskarte der CDU/CSU Zweitstimmenergebnisse der Bundestagswahl 2021
Die Grünen (14.8% / 118 seats)

Equal population projection map of the Gruene vote share in the 2021 German General Election / Bevölkerungsrastertransformationskarte der Gruenen Zweitstimmenergebnisse der Bundestagswahl 2021
FDP (11.5% / 92 seats)
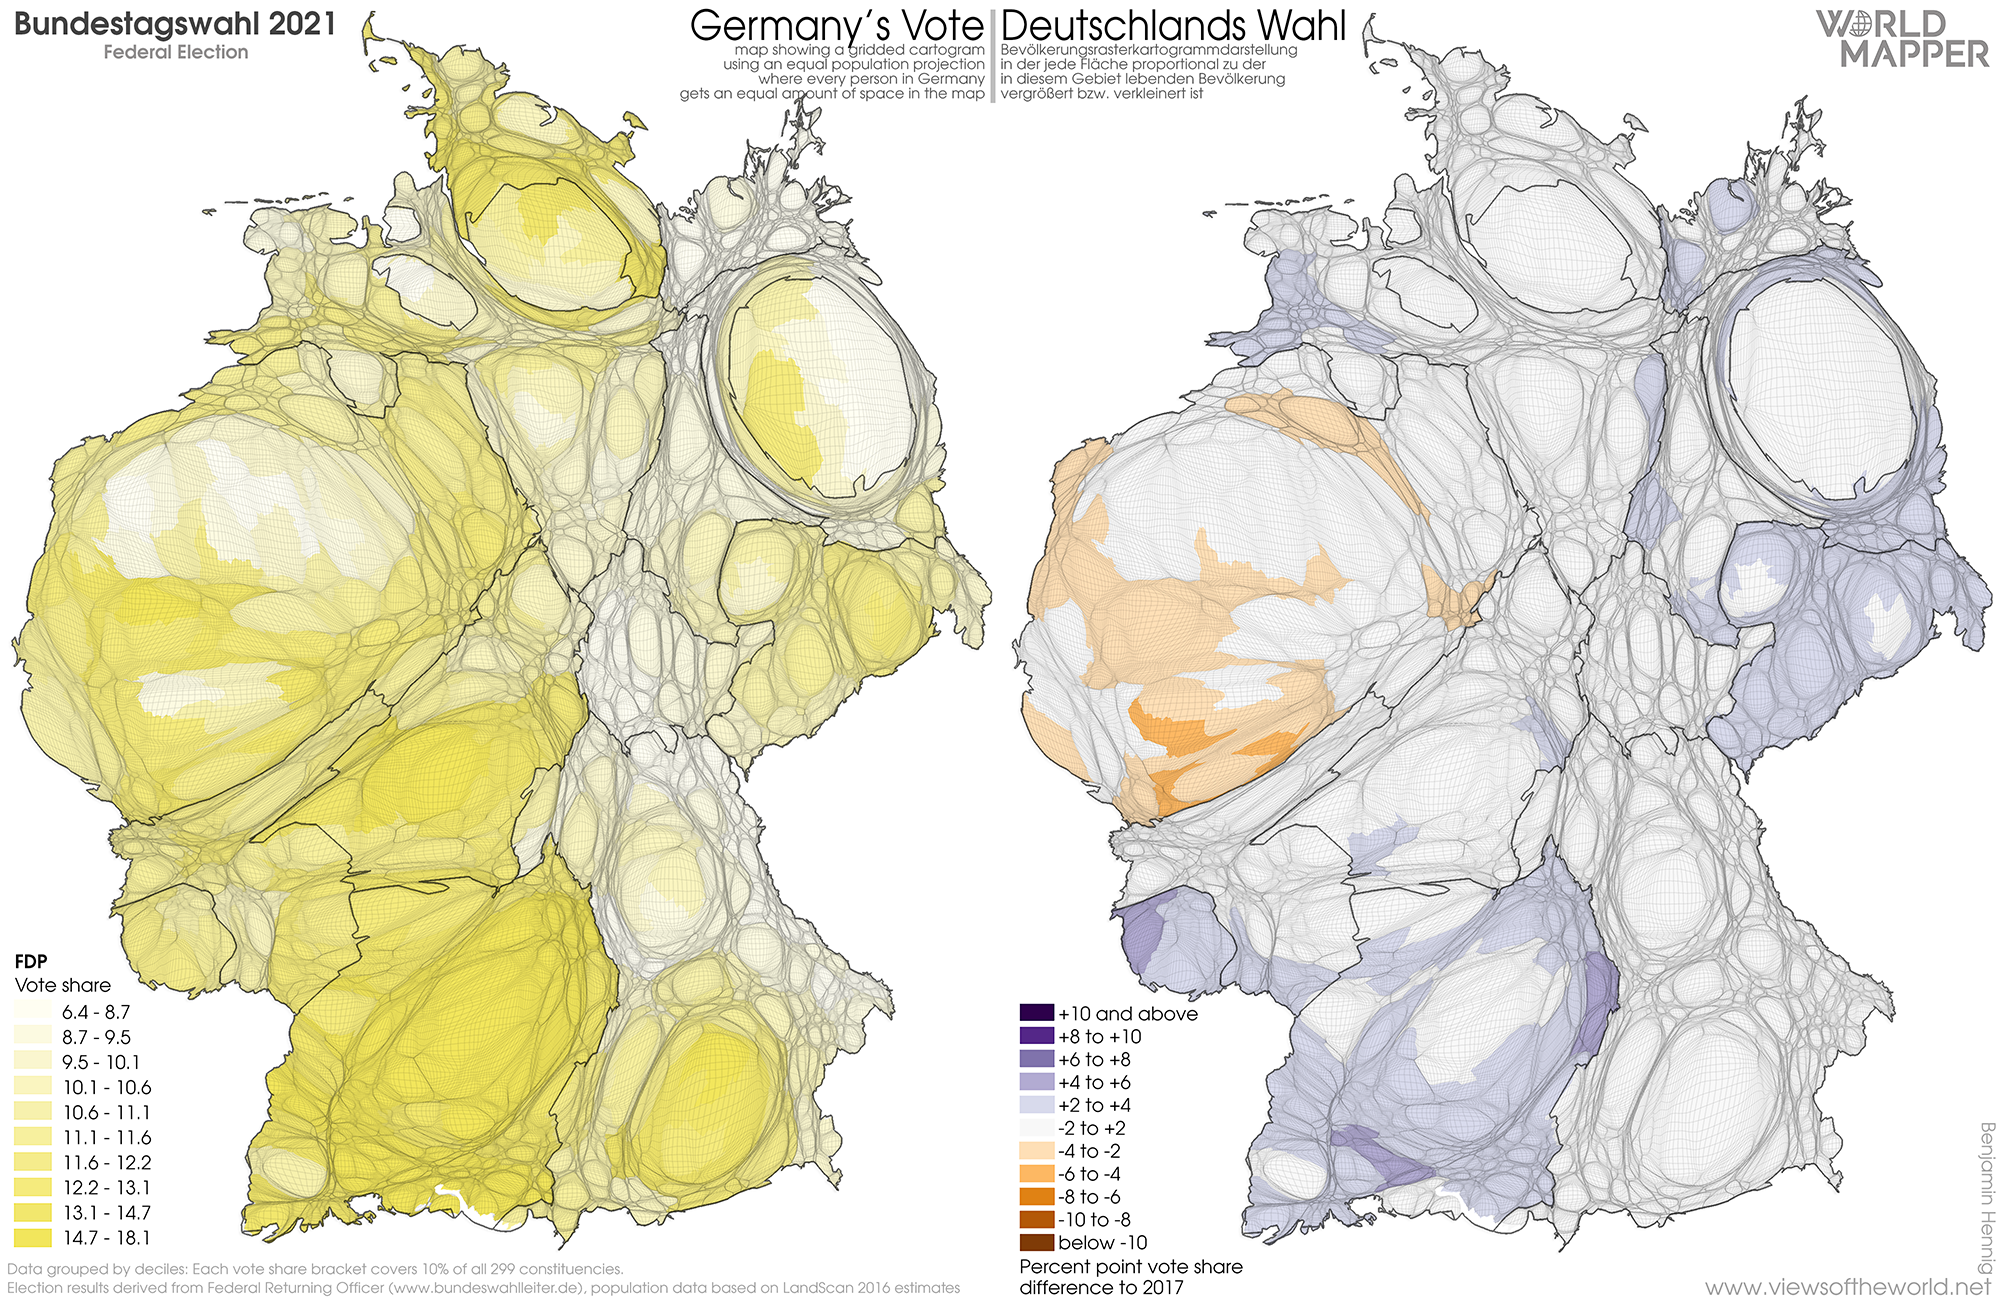
Equal population projection map of the FDP vote share in the 2021 German General Election / Bevölkerungsrastertransformationskarte der FDP Zweitstimmenergebnisse der Bundestagswahl 2021
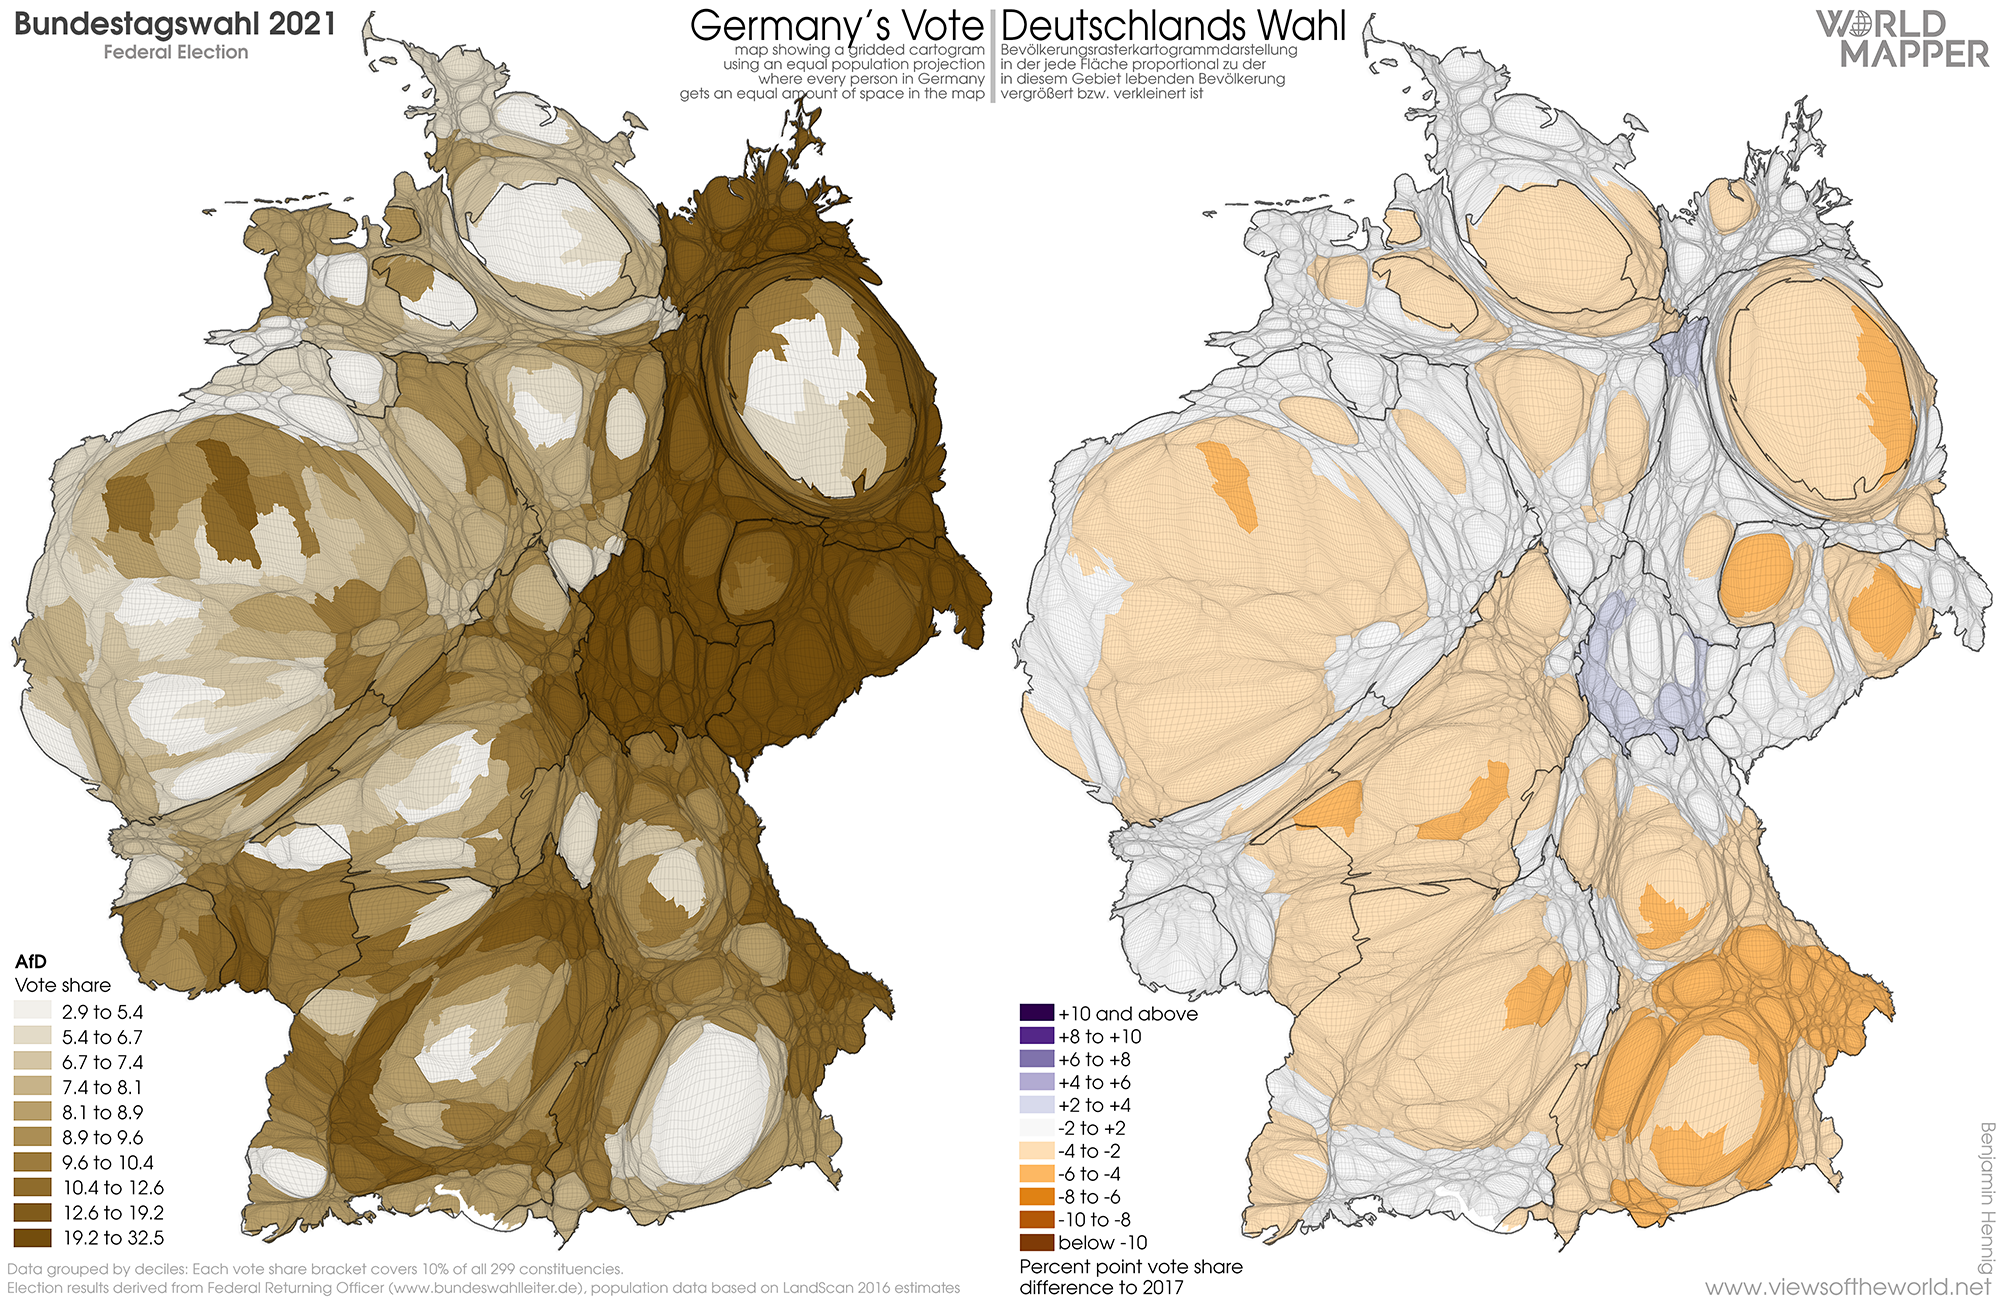
AfD (10.1% / 83 seats)
Die Linke (4.9% / 39 seats)

Equal population projection map of the LINKE vote share in the 2021 German General Election / Bevölkerungsrastertransformationskarte der LINKE Zweitstimmenergebnisse der Bundestagswahl 2021
The map of the overall election results as well as the gridded population cartogram of Germany can also be viewed in the maps section where you find further details about the cartogram, the data and their sources, and also the possibility to obtain map use licenses for commercial use:
Note: All work on Worldmapper.org is licensed under a Creative Commons Attribution – Non Commercial – ShareAlike 4.0 International License. For any commercial use (including in publishing) a map use license needs to be obtained. Contact us for further details.