Worldmapper, on behalf of the Bodleian Libraries Oxford, have analysed over 8,000 tweets since Trump took office and created a cartogram that depicts which countries he has mentioned the most on Twitter – the larger the country, the more tweets they feature in.
- Since he has taken office, Trump has made 1,384 mentions of foreign countries
- Russia tops the bill, with 297 mentions (21 per cent of all tweets mentioning foreign countries)
- North Korea (163), China (158), Mexico (99), Puerto Rico (47), Iran (47), Syria (44), Japan (43), Canada (39) and France (37) complete the Top 10
- Despite the special relationship between the two countries, the UK comes 15th, mentioned in only 1.6 per cent of tweets
- The cartogram has been released ahead of the Bodleian Libraries’ Talking Maps exhibition, which opens on 5 July 2019
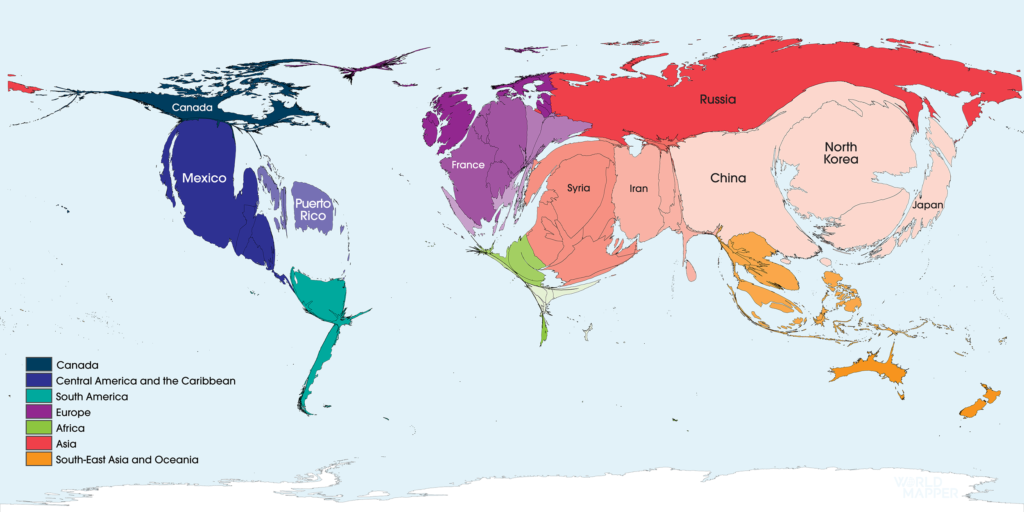
Cartogram showing number of times @RealDonaldTrump mentions specific countries (USA not included).
OXFORD, 3rdJune 2019 – Ahead of US President Donald Trump’s state visit to the United Kingdom, the Bodleian Libraries have released a cartogram that highlights which countries have dominated the presidential twitter feed (@RealDonaldTrump), since he was elected on 8 November 2016.
The map shows an analysis of almost 8,300 tweets and retweets in that period, of which 1,384 mentioned foreign powers. The map does not include the USA; hence it does not appear on the image.
The analysis, conducted by Worldmapper, on behalf of the Bodleian Libraries, extracted all mentions of foreign countries, including some non-conventional references (such as ‘#NoKo’ for North Korea) to build a complete picture of which countries appear most dominant in Trump’s foreign policy.
Despite the UK’s special relationship with the USA, it is only mentioned 22 times, the 15th most mentioned country, which represents just 1.6 per cent of all tweets about foreign countries.
In total, 81 countries are mentioned in Trump’s twitter feed. The Top 20 are as follows:
| Country | No. Mentions | % |
| Russia | 297 | 21.5 |
| North Korea | 163 | 11.8 |
| China | 158 | 11.4 |
| Mexico | 99 | 7.1 |
| Puerto Rico | 47 | 3.4 |
| Iran | 47 | 3.4 |
| Syria | 44 | 3.2 |
| Japan | 43 | 3.1 |
| Canada | 39 | 2.8 |
| France | 37 | 2.7 |
| South Korea | 35 | 2.5 |
| Germany | 29 | 2.1 |
| Israel | 24 | 1.7 |
| Vietnam | 24 | 1.7 |
| United Kingdom | 22 | 1.6 |
| Venezuela | 21 | 1.5 |
| Saudi Arabia | 19 | 1.4 |
| Turkey | 18 | 1.3 |
| Singapore | 15 | 1.1 |
| Ukraine | 13 | 0.9 |
This map has been released as part of a series of 500 cartograms developed for Talking Maps, a new exhibition at the Bodleian Libraries, opening on 5 July 2019. On screens in the gallery, visitors will be able to explore thought-provoking digital ‘cartograms’, interactive maps that use statistics and big data to tell powerful stories about our changing world.
Talking Maps celebrates maps and the stories they tell about the places they show and the people that make and use them. The exhibition showcases iconic treasures from the Bodleian’s world-renowned collection of more than 1.5 million maps, together with exciting new works on loan and specially commissioned 3D installations. Featuring ‘imaginary maps’ such as Grayson Perry’s Red Carpet and Map of Nowhere and JRR Tolkien’s maps of Middle-earth, the exhibition offers a new perspective on the enduring power of maps. The exhibition also explores the latest digital developments in cartography such as the ‘Trump tweets’ cartogram as well as cartograms exploring such topics as migration, language diversity and politics, power and poverty.
The data was compiled and analysed by Worldmapper, an independent educational project, led by Benjamin Hennig, Associate Professor of Geography at the University of Iceland and Honorary Research Associate at the University of Oxford, and Tina Gotthard, Associate Lecturer at the University of Iceland.
Benjamin Hennig said, “The use of Twitter by Donald Trump is quite unique even in a time where social media appears to be such an influential factor in society. But that Twitter has become a major mean of global policy making is remarkable. The way the president uses this medium to communicate his major policy agendas allows us to utilise this data in an entire new way. The way how the references to other countries have been made since he got elected president tells us a lot about how US foreign policy has been shaped up in the past years. This map makes this much more understandable than any mere number can do. It summarises Trump’s foreign policy priorities in a really thought-provoking way.”
The exhibition is curated by Jerry Brotton, Professor of Renaissance Studies at Queen Mary University of London and author of A History of the World in Twelve Maps,and Nick Millea, Map Librarian at the Bodleian Libraries.
Jerry Brotton, co-curator of the exhibition, said: “Worldmapper’s innovative transformation of online data, such as presidential tweets into a world map reveals powerful stories about the world around us, and shows the enduring power of maps, whether they are made from paper or pixels.”
Nick Millea, co-curator of the exhibition, said: “Thanks to Worldmapper’s inventive cartographic input, we have been able to bring Talking Maps right up to date, demonstrating how maps can convert data into a dramatic and eye-catching spectacle”
Notes:
*not including United States of America, but including Puerto Rico as an unincorporated territory of the United States. Using all tweets and retweets made by the account @RealDonaldTrump.
Analysis by worldmapper.org, using data from Twitter extracted on 15.05.2019
The Bodleian Libraries gratefully acknowledges the support received from donors who have made the Talking Maps exhibition possible.
About Talking Maps
Talking Maps celebrates maps and the stories they tell about the places they show and the people that make and use them. The exhibition showcases iconic treasures from the Bodleian’s world-renowned collection of more than 1.5 million maps, together with exciting new works on loan and specially commissioned 3D installations. Featuring ‘imaginary maps’ such as Grayson Perry’s Red Carpetand Map of Nowhereand JRR Tolkien’s maps of Middle-earth, the exhibition offers a new perspective on the enduring power of maps.
5 July 2019 – 8 March 2020, The Weston Library, Bodleian Libraries, Oxford, Free admission, no booking required
The map can also be viewed in the maps section of the Worldmapper website where you find further details about the cartogram, the data and its sources, and also the possibility to obtain map use licenses for commercial use:
Note: All work on Worldmapper.org is licensed under a Creative Commons Attribution – Non Commercial – ShareAlike 4.0 International License. For any commercial use (including in publishing) a map use license needs to be obtained. Contact us for further details.