Last Update of this page: 6 January 2021
You can find previous updates in part 1 of this chronology
“#China has reported to WHO a cluster of #pneumonia cases —with no deaths— in Wuhan, Hubei Province 🇨🇳 . Investigations are underway to identify the cause of this illness.” This tweet sent out by the World Health Organization (WHO) one year ago broke the news of what was to become the defining global health challenge in 2020. Two and a half weeks later (21.01.2020) WHO started releasing regular situation reports of this previously unknown virus disease that was first reported to the organisation’s country office in China on 31st December 2019. First broadly referred to as Coronavirus, the outbreak was declared a Public Health Emergency of International Concern on 30 January. The disease is now called COVID-19 (transmitted through the SARS-CoV-2 virus) and has been characterised as a global pandemic on 11 March 2020 due to the ‘the alarming levels of spread and severity.’ One year after the (known) outbreak in China (as of 5 January 2021) there have been 84,474,195 confirmed cases of COVID-19, including 1,848,704 deaths, which were reported to WHO.
On this page you find our rolling coverage and updates of the pandemic as it continues to unfold. In our map archive we keep all the most recent updates, while you can view previous versions of these maps in this blog (consisting of part 1 for 2020 and part 2 for 2021). Please note that for the relative data displays the colours have changing values since the case and mortality incidence rates are highly dynamic and keep evolving as the pandemic progresses. It is also important to keep in mind that the picture provided here reflects the situation as it is reported by the individual national health authorities. Case numbers have throughout the course of the pandemic believed to be higher than the reported cases, while the unknown figures may vary significantly between countries. Numbers from poorer countries, especially on the African continent, are believed to be highly underreported. This can – amongst other issues (including political ones) – partly be explained through different testing strategies.
Overview of monthly cases and deaths – see accumulated figures in the updates below
Corona cases month-by-month:
- Covid-19 Map Animation
- Covid-19/Coronavirus cases December 2020
- Covid-19/Coronavirus cases November 2020
- Covid-19/Coronavirus cases October 2020
- Covid-19/Coronavirus cases September 2020
- Covid-19/Coronavirus cases August 2020
- Covid-19/Coronavirus cases July 2020
- Covid-19/Coronavirus cases June 2020
- Covid-19/Coronavirus cases May 2020
- Covid-19/Coronavirus cases April 2020
- Covid-19/Coronavirus cases March 2020
- Covid-19/Coronavirus cases February 2020
- Covid-19/Coronavirus cases January 2020
Corona deaths month-by-month:
- Covid-19/Coronavirus deaths December 2020
- Covid-19/Coronavirus deaths November 2020
- Covid-19/Coronavirus deaths October 2020
- Covid-19/Coronavirus deaths September 2020
- Covid-19/Coronavirus deaths August 2020
- Covid-19/Coronavirus deaths July 2020
- Covid-19/Coronavirus deaths June 2020
- Covid-19/Coronavirus deaths May 2020
- Covid-19/Coronavirus deaths April 2020
- Covid-19/Coronavirus deaths March 2020
- Covid-19/Coronavirus deaths February 2020
- Covid-19/Coronavirus deaths January 2020
STATUS UPDATE 1 January 2021
2020: A year in review
The monthly maps of new registered cases – and deaths – shows how the pandemic developed geographically, first, second and third waves are better recognisable than in our maps with accumulated cases and deaths. During the January of 2020 the disease spread further within China and also started to venture into neighbouring (and some further away) countries. During February new regional hotspots developed in South Korea, Italy and Iran. During March the disease spread further mostly in Central and Southern Europe and the USA. In the month of April the disease continues to spread in the USA, and within Europe the United Kingdom is taking center stage and Turkey and Russia are joining the group of new regional hotspots. Quickly growing numbers in Brazil and Peru are putting South America on the map in May, India does the same for South Asia. In June Brazil overtook the USA in terms of new confirmed cases. In July the USA took the first place again and South Africa joined the top five. In August India had the highest number of new infections and Colombia and Peru joined the top five and a second wave pushed Spain back in the top 10 countries. In September the top 3 countries remained unchanged: India, the USA and Brazil. With Spain and France two European countries entered again the centre stage. This showed the trend for October when Europe becomes again the epicentre of the pandemic. While India and the USA still have the highest amount of new cases, France is moving to third place, the United Kingdom is now on fifth place. Spain, Italy, Belgium, Czechia, Germany and the Netherlands also moved into the Top 15. In November the USA and India switched places again. Italy, France and Brazil complete the top 5, followed by Russia, Poland, UK, Germany and Spain. There is no real trend change in December: most new cases are still registered in the USA (6.3 million), followed by Brazil (1.3 million), Russia (863,643), India (834,983) and the UK (815,561). Turkey, Germany, Italy, France and Ukraine complete the top 10. You can see how the pandemic evolved throughout the year in our Covid-19 Map Animation.
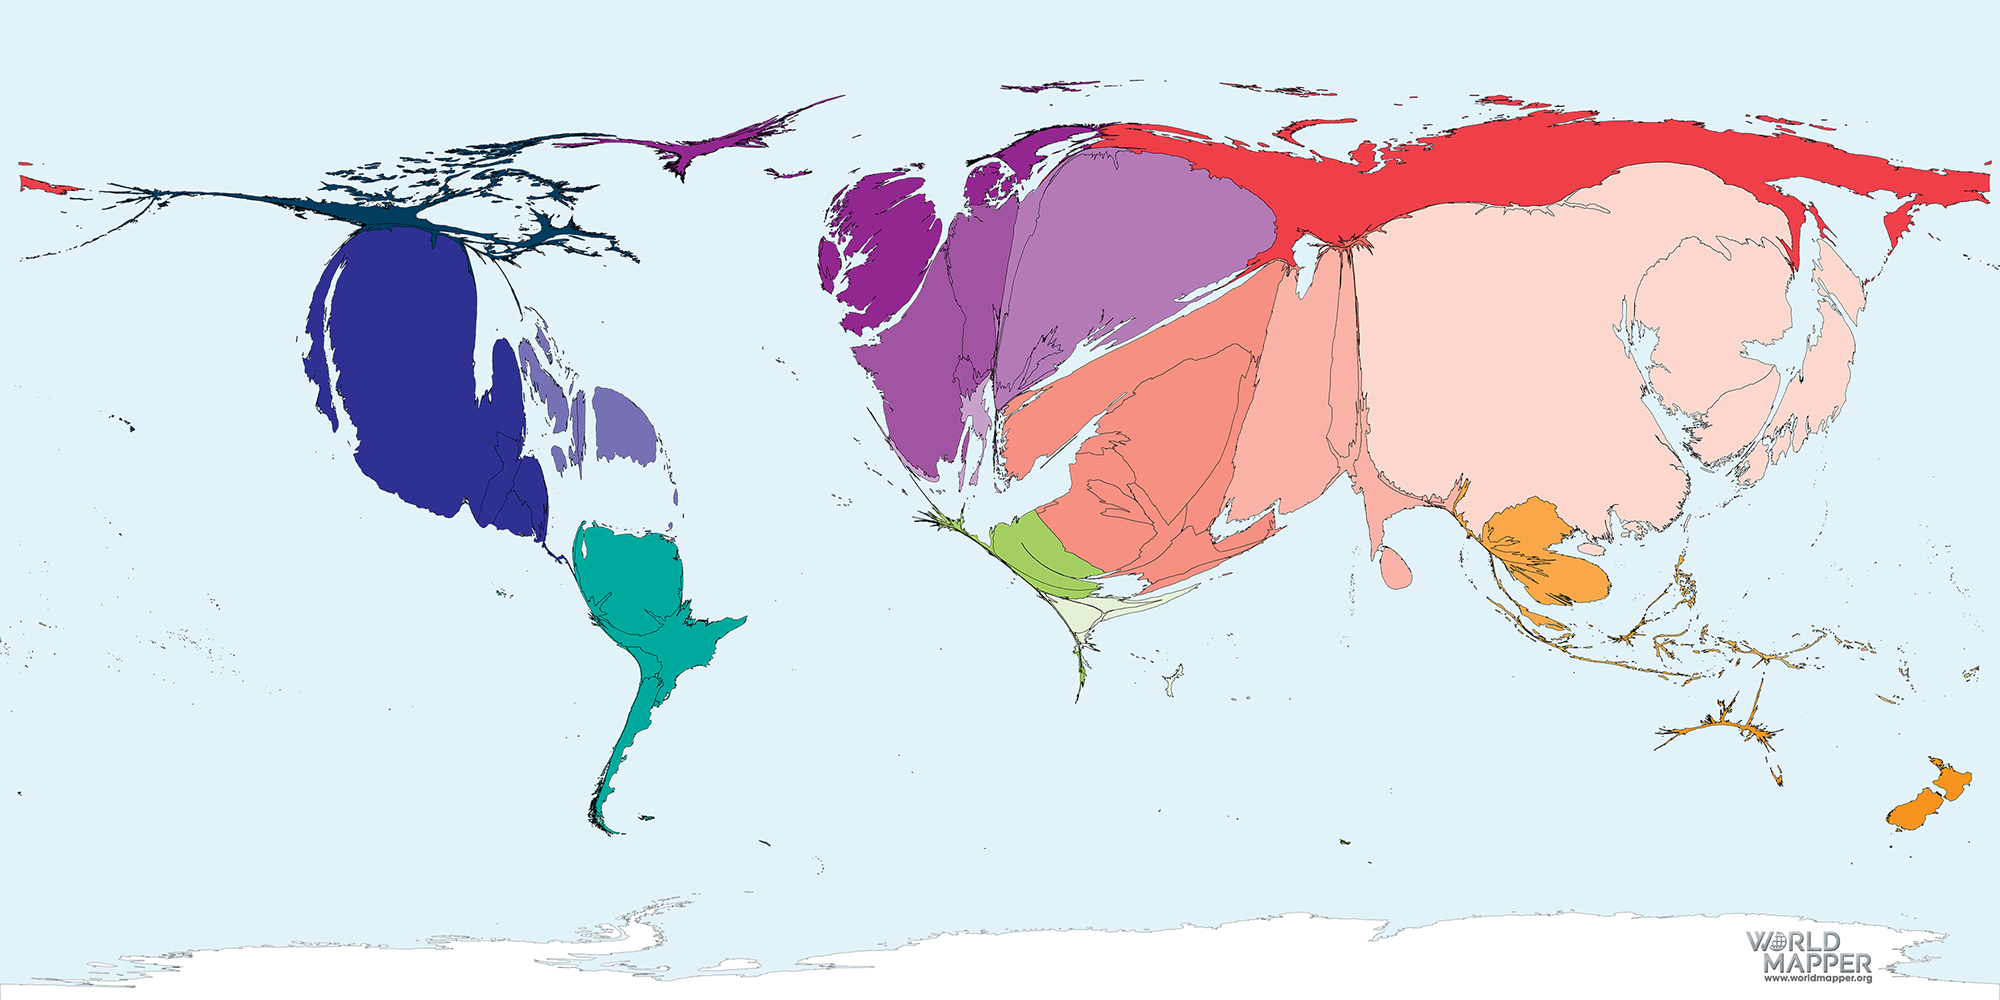
After almost a year of living with COVID-19, the highest number of total cases is recorded in the United States of America (19,147,627), followed by India (10,244,852), Brazil (7,504,833), Russia (3,131,550) and France (2,530,400). United Kingdom (2,382,869), Italy (2,067,487), Spain (1,893,502), Germany (1,687,185) and Colombia (1,603,807) complete the top 10.

Accumulated Coronavirus cases as of 01 January 2021 (above)
Highest per capita cases are often found in states with smaller populations where testing may lead to more detected cases. The highest number of reported cases per 100,000 people is now found in Andorra (10,249), followed by Montenegro (7,654), Luxembourg (7,362), San Marino (6,874) and the Czech Republic (6,552). Of the countries with very high total case numbers, the United States of America have a count of 5,785 cases per 100,000 people (with a total of 19 million cases), followed by India (10 million total, 742 relative) and Brazil (7.7 million total, 3,531 relative).

Reported Coronavirus case rates (per 100,000 people) as of 01.01.2021 (above)
The map of the total deaths due to Covid-19 varies only slightly from the map showing the total cases. Especially remarkable is the case of Mexico, with a high mortality rate. The highest number of deaths recorded now in the United States of America (332,423), followed by Brazil (191,570), India (148,439), Mexico (122,855), Italy (73,029), United Kingdom (71,567), France (63,701), Russia (56,426), Iran (54,946) and Spain (50,442).

Accumulated Coronavirus deaths as of 01 January 2021 (above)
The highest mortality rates (reported deaths per 100,000 people) are found in San Marino with 174, followed by Belgium (168), Slovenia (126), Bosnia and Herzegovina (123) and Italy (120). 14 countries currently have a mortality rate of 100 or above, including Spain (108), the United Kingdom (105) and the United States of America (100).

Reported Coronavirus mortality (deaths per 100,000 people) as of 01.01.2021 (above)
The highest case mortality rates (reported deaths per number of confirmed cases) are found in Yemen with 29.1%, followed by Mexico (8.8%) and Montserrat (7.7%).
China now has a reported case mortality rate of 5%, while the United States reported a mortality of 1.7%. Of the countries with many reported cases, India, Brazil and France have relatively low reported case mortality rates (1.4%, 2.6% and 2.5% deaths of all reported cases).
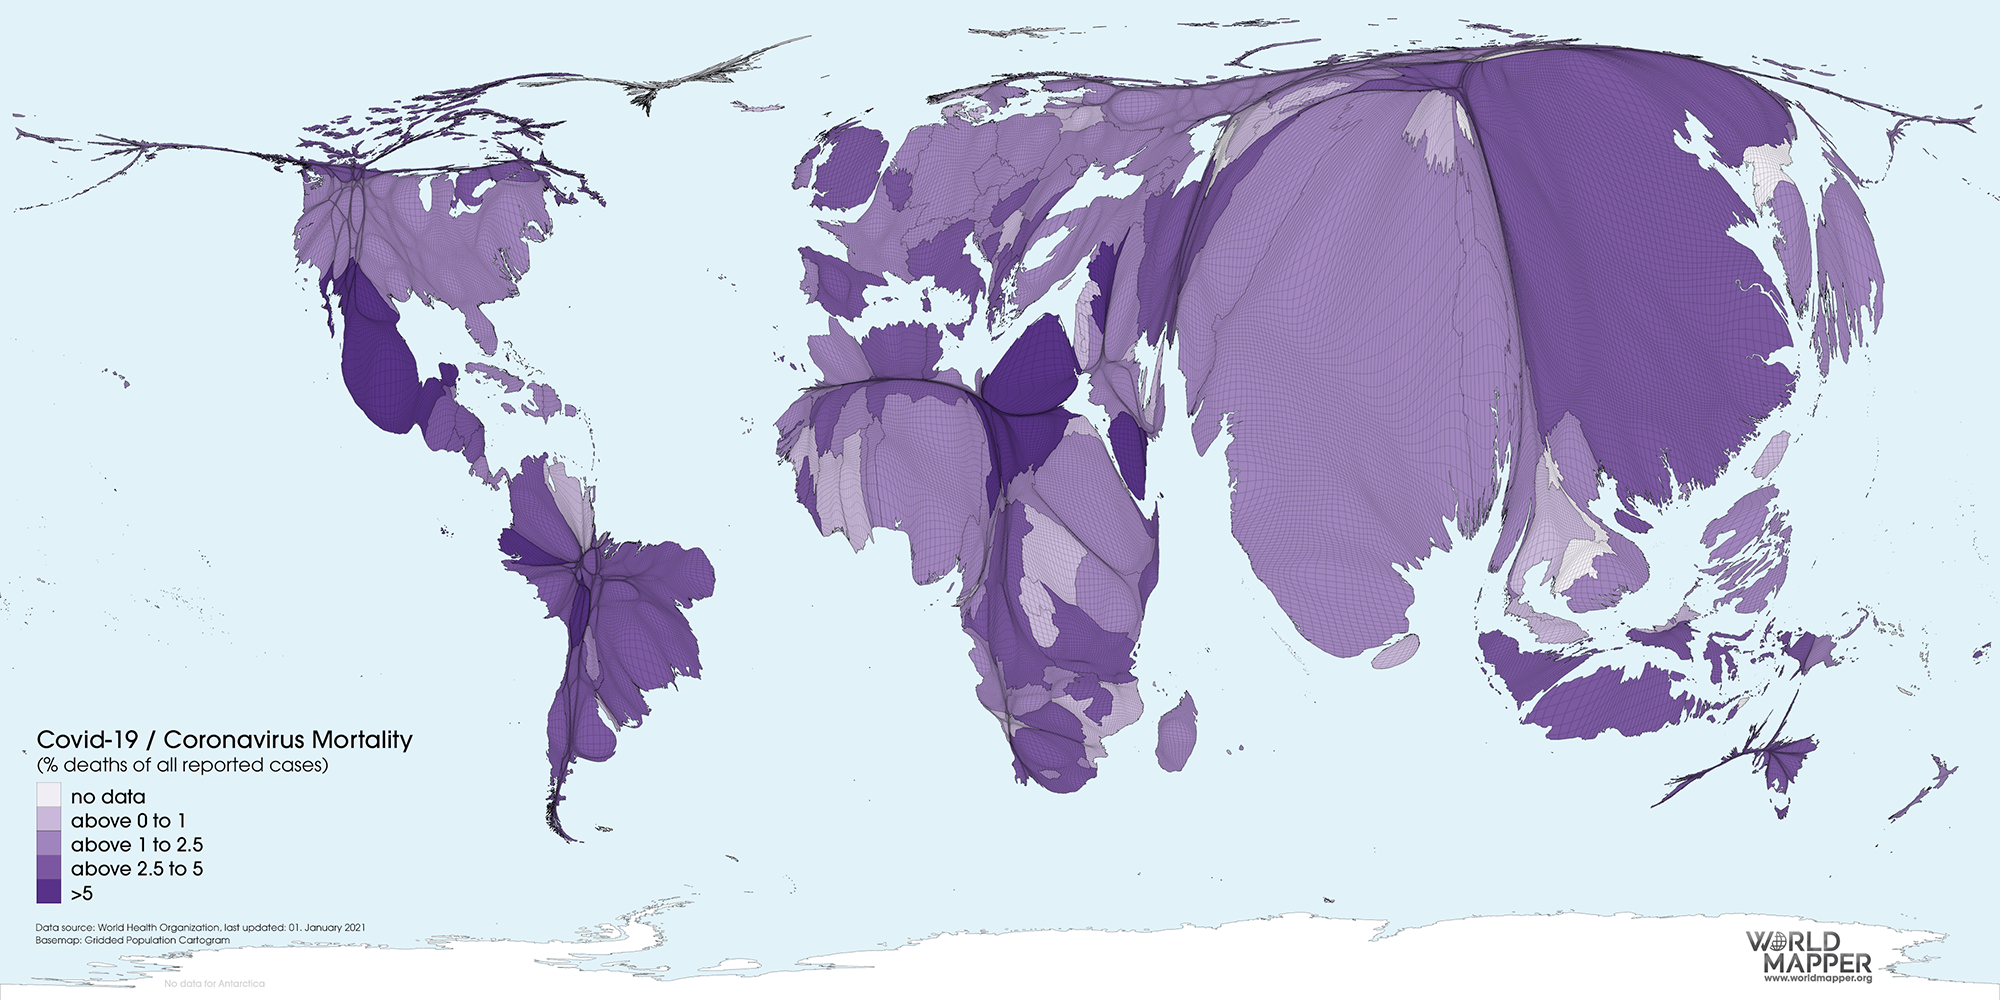
Coronavirus case mortality (% deaths per reported cases) as of 01.01.2021 (above)
Find previous updates in part 1 of this chronology
Some of our Covid-19/Coronavirus cartograms can also be viewed in the maps section where you find further details about the cartogram, the data and their sources, and further copyright information:
- COVID-19/Coronavirus cases
- COVID-19/Coronavirus cases per capita
- COVID-19/Coronavirus deaths
- COVID-19/Coronavirus case mortality
- COVID-19/Coronavirus mortality per capita
Please contact us for further details on the terms of use.